Introduction & Instructions
for
Friction Loss Calculator
for
Friction Loss Calculator
Reference Tip
RT5010
RT5010
Technical Bulletin Series
|
|
Introduction & Instructions for Friction Loss Calculator |
|
Reference Tip RT5010 |
Technical Bulletin Series
|
|
Go to Instructions ☀
|
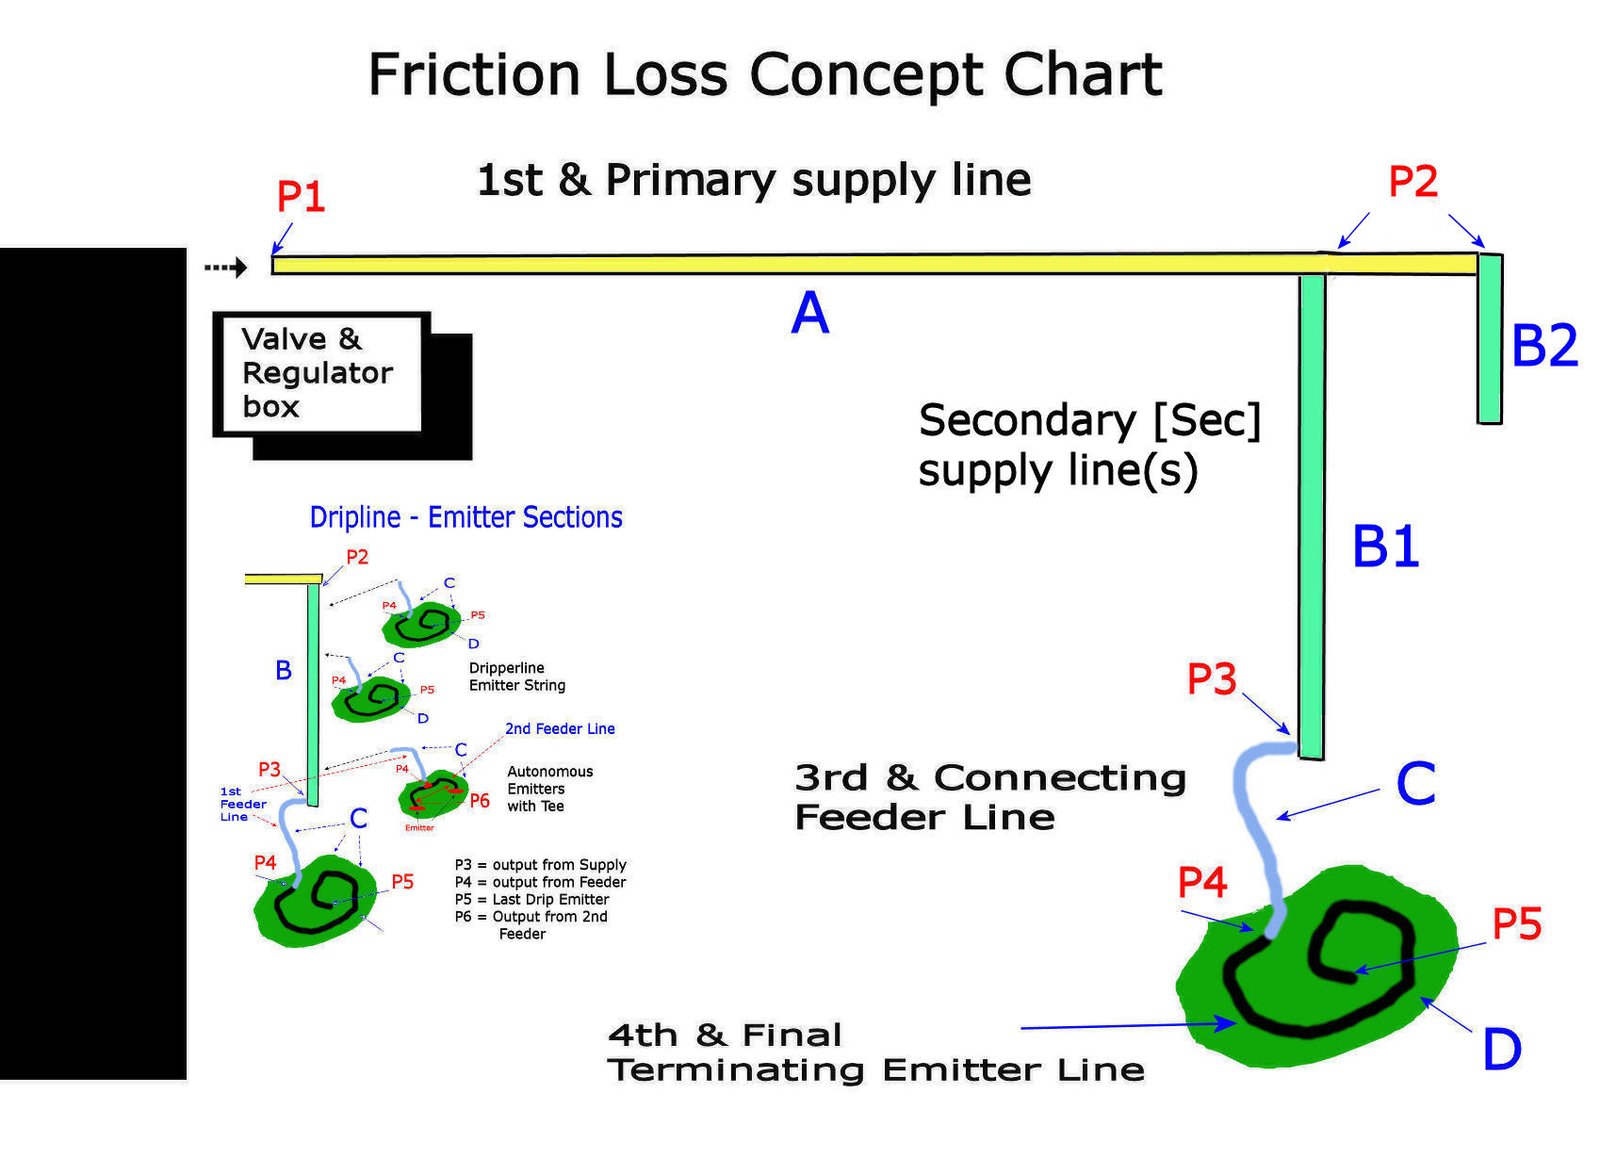
Common Designs Typically a [½ or ¾"] PVC line is connected to a pressure regulator following the valve and filter for a particular zone. This supply line is often followed by a secondary; ½" Black/Brown Poly tubing. The terminating emitters are located in the Feeder Section and can either be Dripperline or Individual autonomous emitters. Dripperline has the emitters built into; either a ¼ or ½" diameter dripline. The emitters are then spaced (6", 12", 18") between. With sandy (fast draining soil) or smaller plants the chioce is usually ¼" tubing with 6" spacing. Sometimes due to resticted runtime options, this condensed line is selected in order to apply more water in less time. Larger irrigation areas will do best with 12" or even 18" spacings. ½" diameter dripline is more durable for higher traffic areas or for sub-surface installation. If autonomous emitters are used, these generally run with flow rates from 0.5 to 15 gph (depending on the type). If more than a single autonomous emitter is used, there will be a "Tee" and a second feeder line used prior to the terminating emitters. Due to the complexity of utilizing many extra connectors, and selecting proper emitter location to assure good distribution, Dripperline has become very popular. The GG-Friction Loss Calculator will analyze one (1) Feeder Section, and it's Supply Lines "A" & "B1" at a time. This analysis will provide an accurate calculation for all similarly designed sections within that group. If other feeder sections have significantly different demand and design - only the data in section 5 need be reviszed in order to provide analysis on these differing sections. In the likely event that the sections in a group are dissimilar, or the groups are dissimilar within the same Supply combination; there are instructions to guide you through the process. |
These instructions include details
for more complex irrigation designs. Such as:
A) Multiple secondary supply lines. B2, B3, etc. B) High Flow Rate (over 150 gph) demand on the Primary or Secondary supply lines. C) Feeder sections with dissimilar emitter types Instructions Section 1 1) Note: Regulated Supply pressure [psi) [P1] 1.1) This is set by the pressure regulator used. 2) Estimating total Feeder Demand 2.1) When multiple secondary supply lines are connected to the same primary line; an additional analysis will be needed for each. Example (refer to Image 1) 2.11) The closest secondary supply is "B1" 2.12) This supply will be used for initial analysis 2.13) Determine the total Feeder Sections demand as supplied from secondary supply lines "B2, B3" etc. (not B1) 2.14) Note the emitter qty & avg. flow rate 2.141) This total demand will be entered at step (2.17) If the current design for Supply "A" is large & complex an estimated summary will suffice. Good Drip designs feed at approx. (0.35 to 1.75 gph) 1.0 gph per sq. ft. avg » depending on soil composition. Set gph at 1.0 gph & set Qty at 1 times area sq.ft. 2.15) Information for multiple secondary supplies (B2..) Note: though these will be evaluated in subsequent analyses, their total demand must be estimated here. as this will impact PSI drop on supply "A" 2.16) Total the Feeder Sections demand for subsequant secondary supply line; "B2, B3" 2.17) The 4th row of Groups (Section 1) provides the option to input demand from the multiple secondary supplies (see 4.1). This demand will not be applied to supply line "B1" in (Sec. 3 1st analysis). Estimating Combined Feeder Demand Looking at Calculator Data Input Section 1 2.2) "Output PSI" from Valve @ regulator [P1] This pressure will be input to section 1. 2.3) Feeder Demand from "B1" » Determine Feeder demand for each section. » Demand is Emitter gph and Qty' » Total the (emitter qty & flow rate) for all sections in each group. » Data Entry - Use Drop-Down box 2.31) This may require more than one group 2.4) Information for different groups Feeder Sections with similar demand should be assigned to the same group Those Feeders with significantly higher or lower demand put into another group 2.41) Sections with similar demand - 1 group » Count the number of groups. » Note the Emitter Qty & Rate within each group. 2.43) A max of 4 groups is provided 2.44) Data Entry Analysis #1, section 1. » Input Emitter Demand 1st group Enter Gph - Qty - # of Groups (similar demand) » Input Emitter Demand 2nd, (3rd) groups Enter Gph - Qty - # of Groups (similar demand) 2.45) If design has more than 3 groups: total the demand from all other Sections, Avg. flow rate & total quantity 3rd group. Data Enty - into 3rd Group put rate & qty Use Drop-Down boxes The 4th group for multi-secondary only. 2.5) Data Entry Analysis #1 section 1 Input total flow demand from secondary supply See (2.16) for details. Estimating Line "A" PSI Loss [section 2] Look at Calculator Data Input Section 2 3.1) Select the type of Supply Piping used. from drop-down box 3.2) Determine the length of this Supply Line use drop-down box to enter data. 3.3) If the end of this line is elevated, estimate use drop-down box - enter feet up + or - 3.4) Press Calculate-A & analysis will report Input & Output PSI 3.5) Supply line "B2, etc." were used for pressure loss through this supply line "A" Estimating Line "B" PSI Loss [section 3] Look at Calculator Data Input Section 3 4.1) Select the type of Secondary Supply Line. from drop-down box 4.2) Determine the length of this Supply Line use drop-down box to enter data. 4.3) If the end of this line is elevated, estimate use drop-down box - enter feet up + or - 4.4) Press Calculate-B & analysis will report Input & Output PSI Note: Supply lines "B2, etc." are NOT used to determine pressure loss across B1 supply line Termination Feeder Section Data [sections 4 & 5] Look at Calculator Data Input Section 4 5.1) Determine if type of emitters used are "Dripperline" or Individual Emitters 5.2) Select the type of Feeder Emitters used. from drop-down box 5.3) When using Dripperline » When using ½" dripline, no ¼" connecting feeder is used. » When using ¼" dripline, a ¼" connecting feeder is used. » Determine the length of ¼" connecting feeder » Data Entry (¼" feeder length) » use drop-down box to enter data. 5.33) Determine the length of the Dripperline » Data Entry (dripperline length) » use drop-down box to enter data. 5.34) Press Calculate-C to perform analysis. 5.4) When using Individual Emitters Look at Calculator Data Input Section 5 5.41) Data Input Analysis #1, section 5 » Data Entry (¼" feeder length) » use drop-down box to enter data. 5.411) When using ½" dripline, no ¼" connecting feeder is used. 5.42) Data Input Analysis #1, section 5 » Data Entry Qty of individual emitters » Data Entry emitter flow rate » use drop-down box to enter data. there can be multiple connectors & feeder lines leading to the end of an individual emitter. » Data Entry Qty of "tees" used to connect » Data Entry length of 2nd feeder line » Use the lower 2 drop down boxes 5.5) Press Calculate-C to perform analysis. A separate Reference document is available to help understand the Friction Loss Report in addition to Summary and Warnings |